GEOL2019STIEFFEL51148 GEOL
Evidence for an Old Parana delta and Diachroneity in Global Highstands
Type: Graduate
Author(s):
Rodney Stieffel
Geological Sciences
Advisor(s):
John Holbrook
Geological Sciences
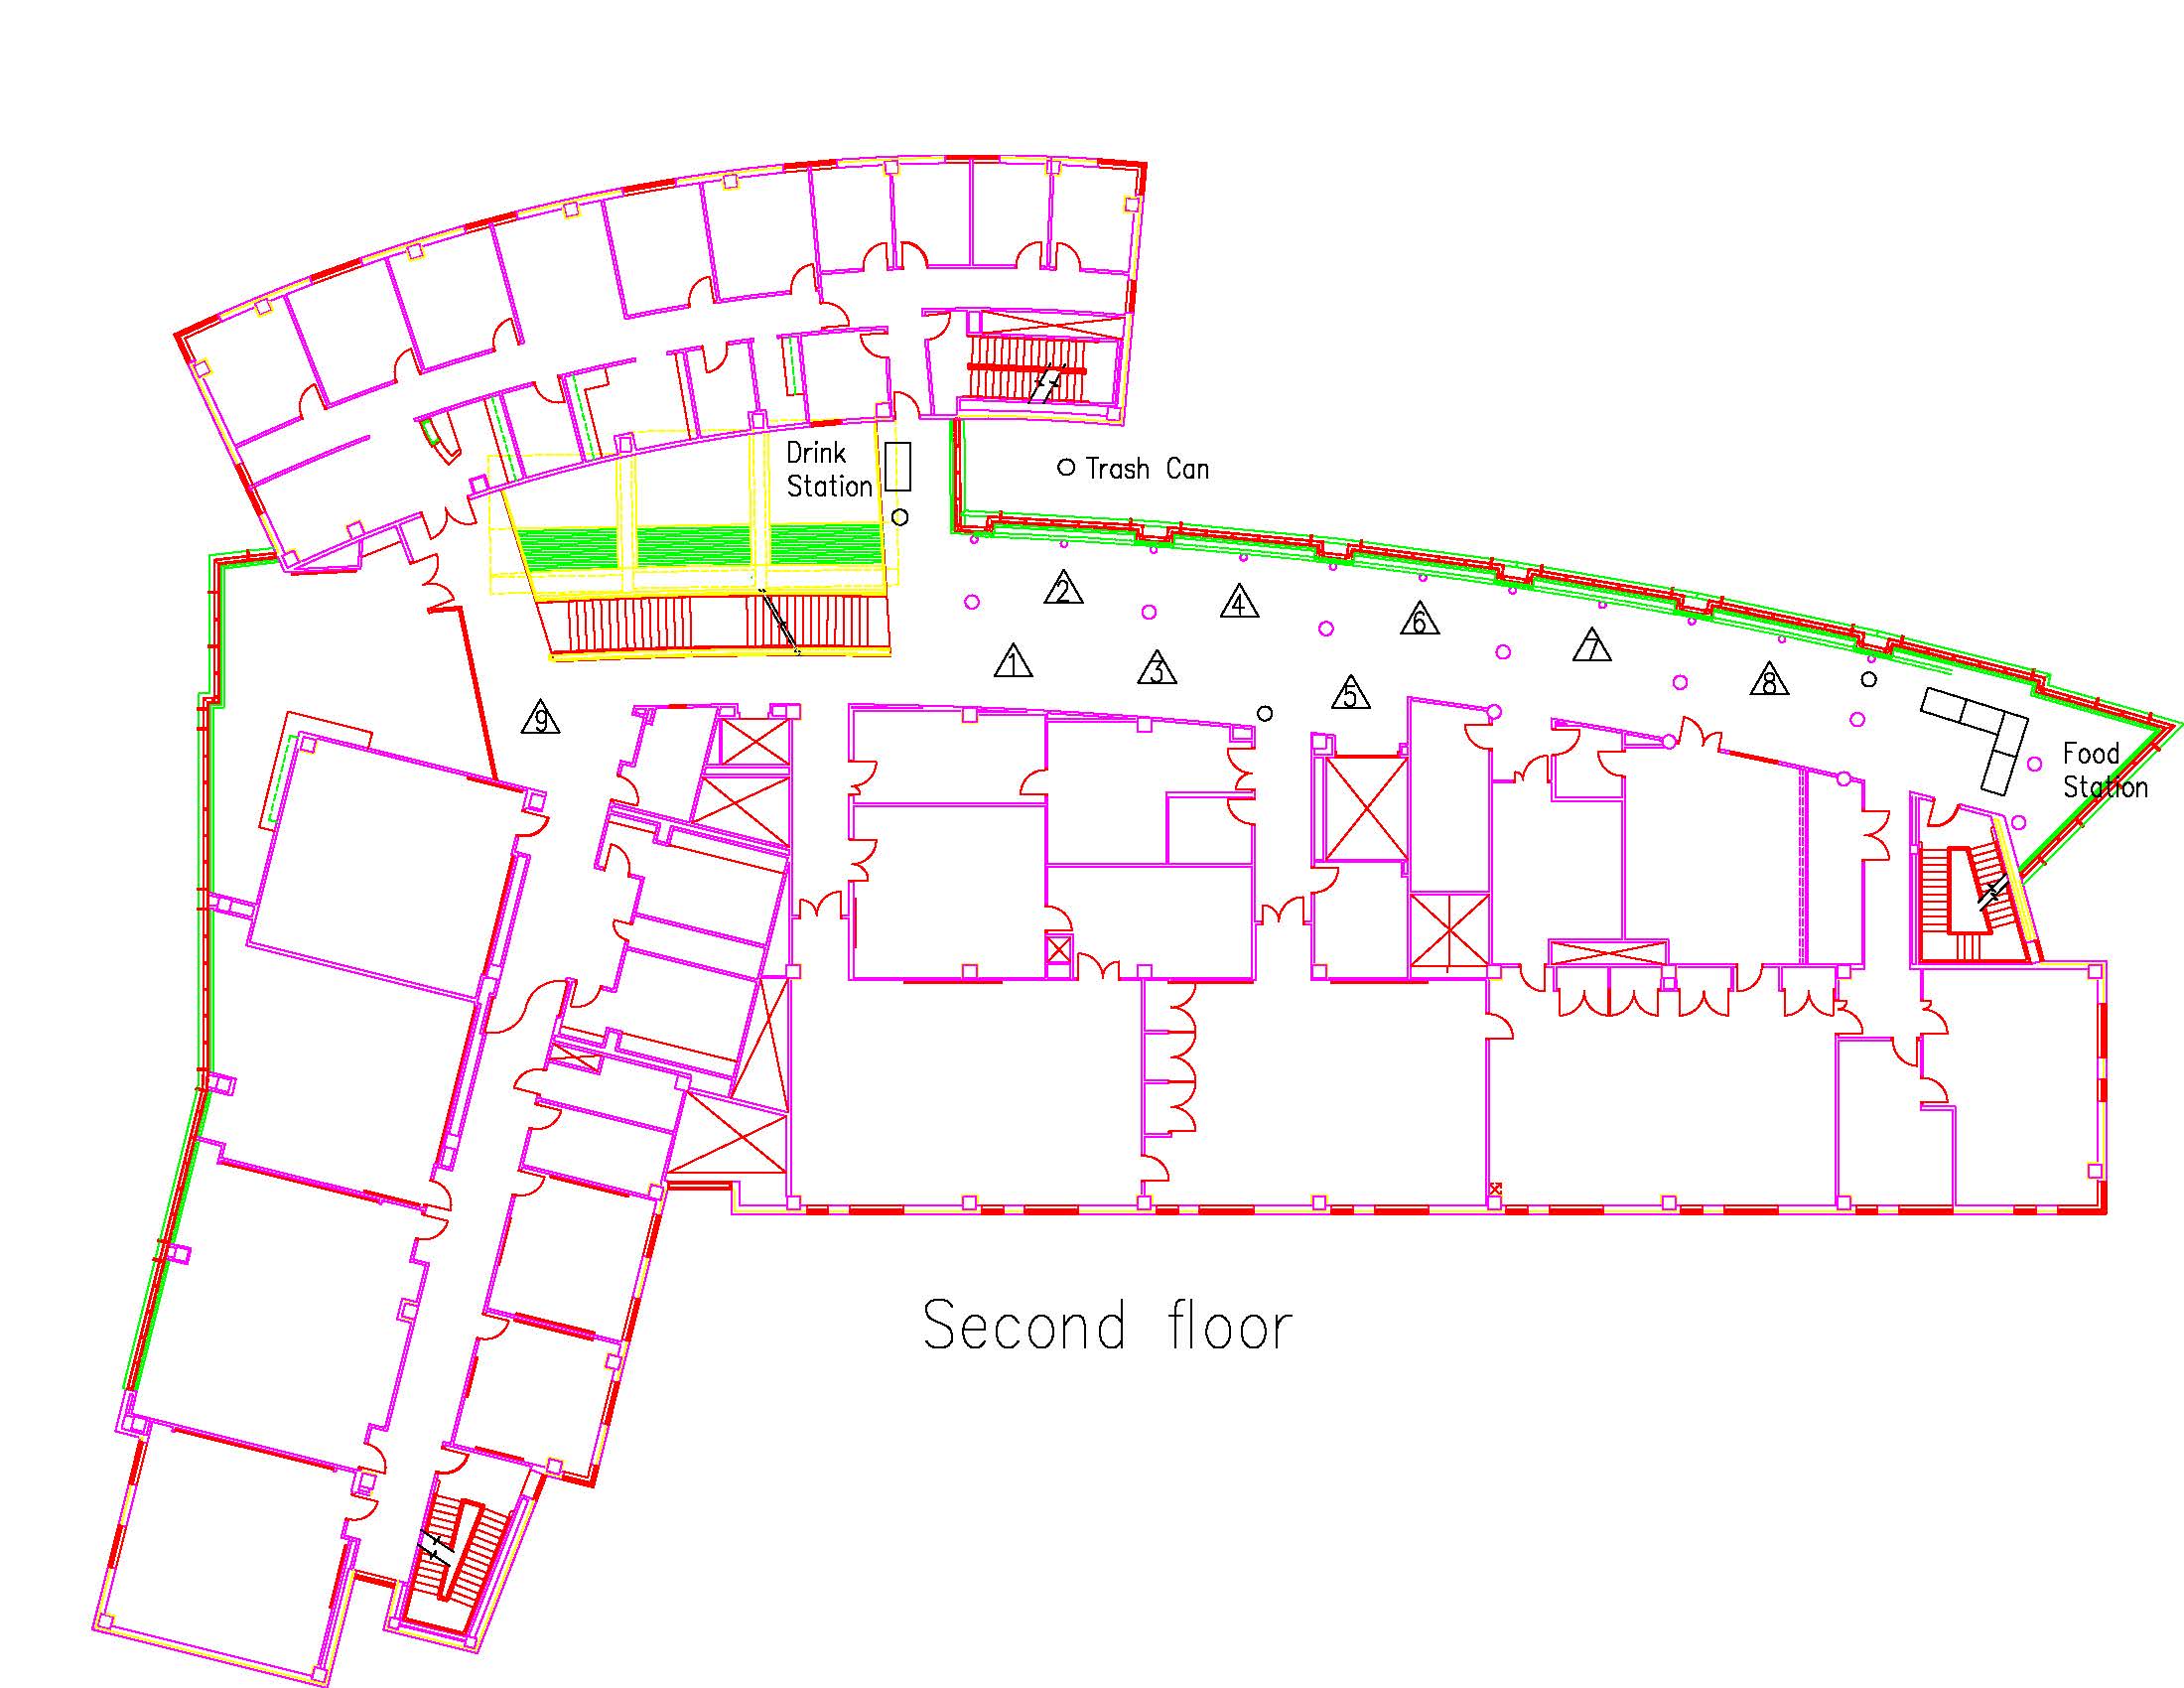
Location: Session: 1; 2nd Floor; Table Number: 4
View PresentationThe highstand deltas of the Holocene tend to each initiate with the peaking of eustatic sea level rise at about 7000 y.b.p. While generally tied to this time, the initiation of highstand shorelines is not necessarily synchronous. Local impacts on relative sea level can impact this timing. In particular, the Parana Delta, Argentina, appears to have initiated as early as 8100 y.b.p., well before the global sea level peak and potentially before any comparable highstand shorelines. The Parana Delta encompasses an area of ~17,400 km2 enclosed in the Rio de la Plata estuary, growing steadily at a rate of approximately 2 km2 yr-1 for roughly the past 6000 yrs. This deltaic system has shifted from fluvial, to wave-dominated, and then back to its present day fluvial dominated system. Aerial and satellite imagery, shallow boreholes, radiometric dating of shells and sand, and Ground Penetrating Radar are used to define the distinctive sedimentary features of the delta. New data from the upper part of the delta indicates the Parana Delta initiated well before the 6000 y.b.p. previously reported. Sediment cores collected from across the upper delta are used to identify sedimentary facies and construct a stratigraphic framework. Three OSL samples collected from the oldest set of beach ridge s indicate the first ridges formed approximately 8100 years ago. These beach ridges are <3 m above sea level and argue for an early peak in relative sea level. Highstand strata are about 6 m thick above a thin (1-2 m) condensed section above transgressive shoreface deposits. The Parana delta initiated at least 1500 years before the sea level peak. Assumptions of synchronicity of highstands with eustatic sea level accordingly must be tempered with comparable allowance for local error.
GEOL2019TALBERT42796 GEOL
Lower Permian and Pennsylvanian Stratigraphy and Shale Gas Potential of the Palo Duro Basin
Type: Graduate
Author(s):
Brendan Talbert
Geological Sciences
Advisor(s):
Cheyenne Xie
Geological Sciences
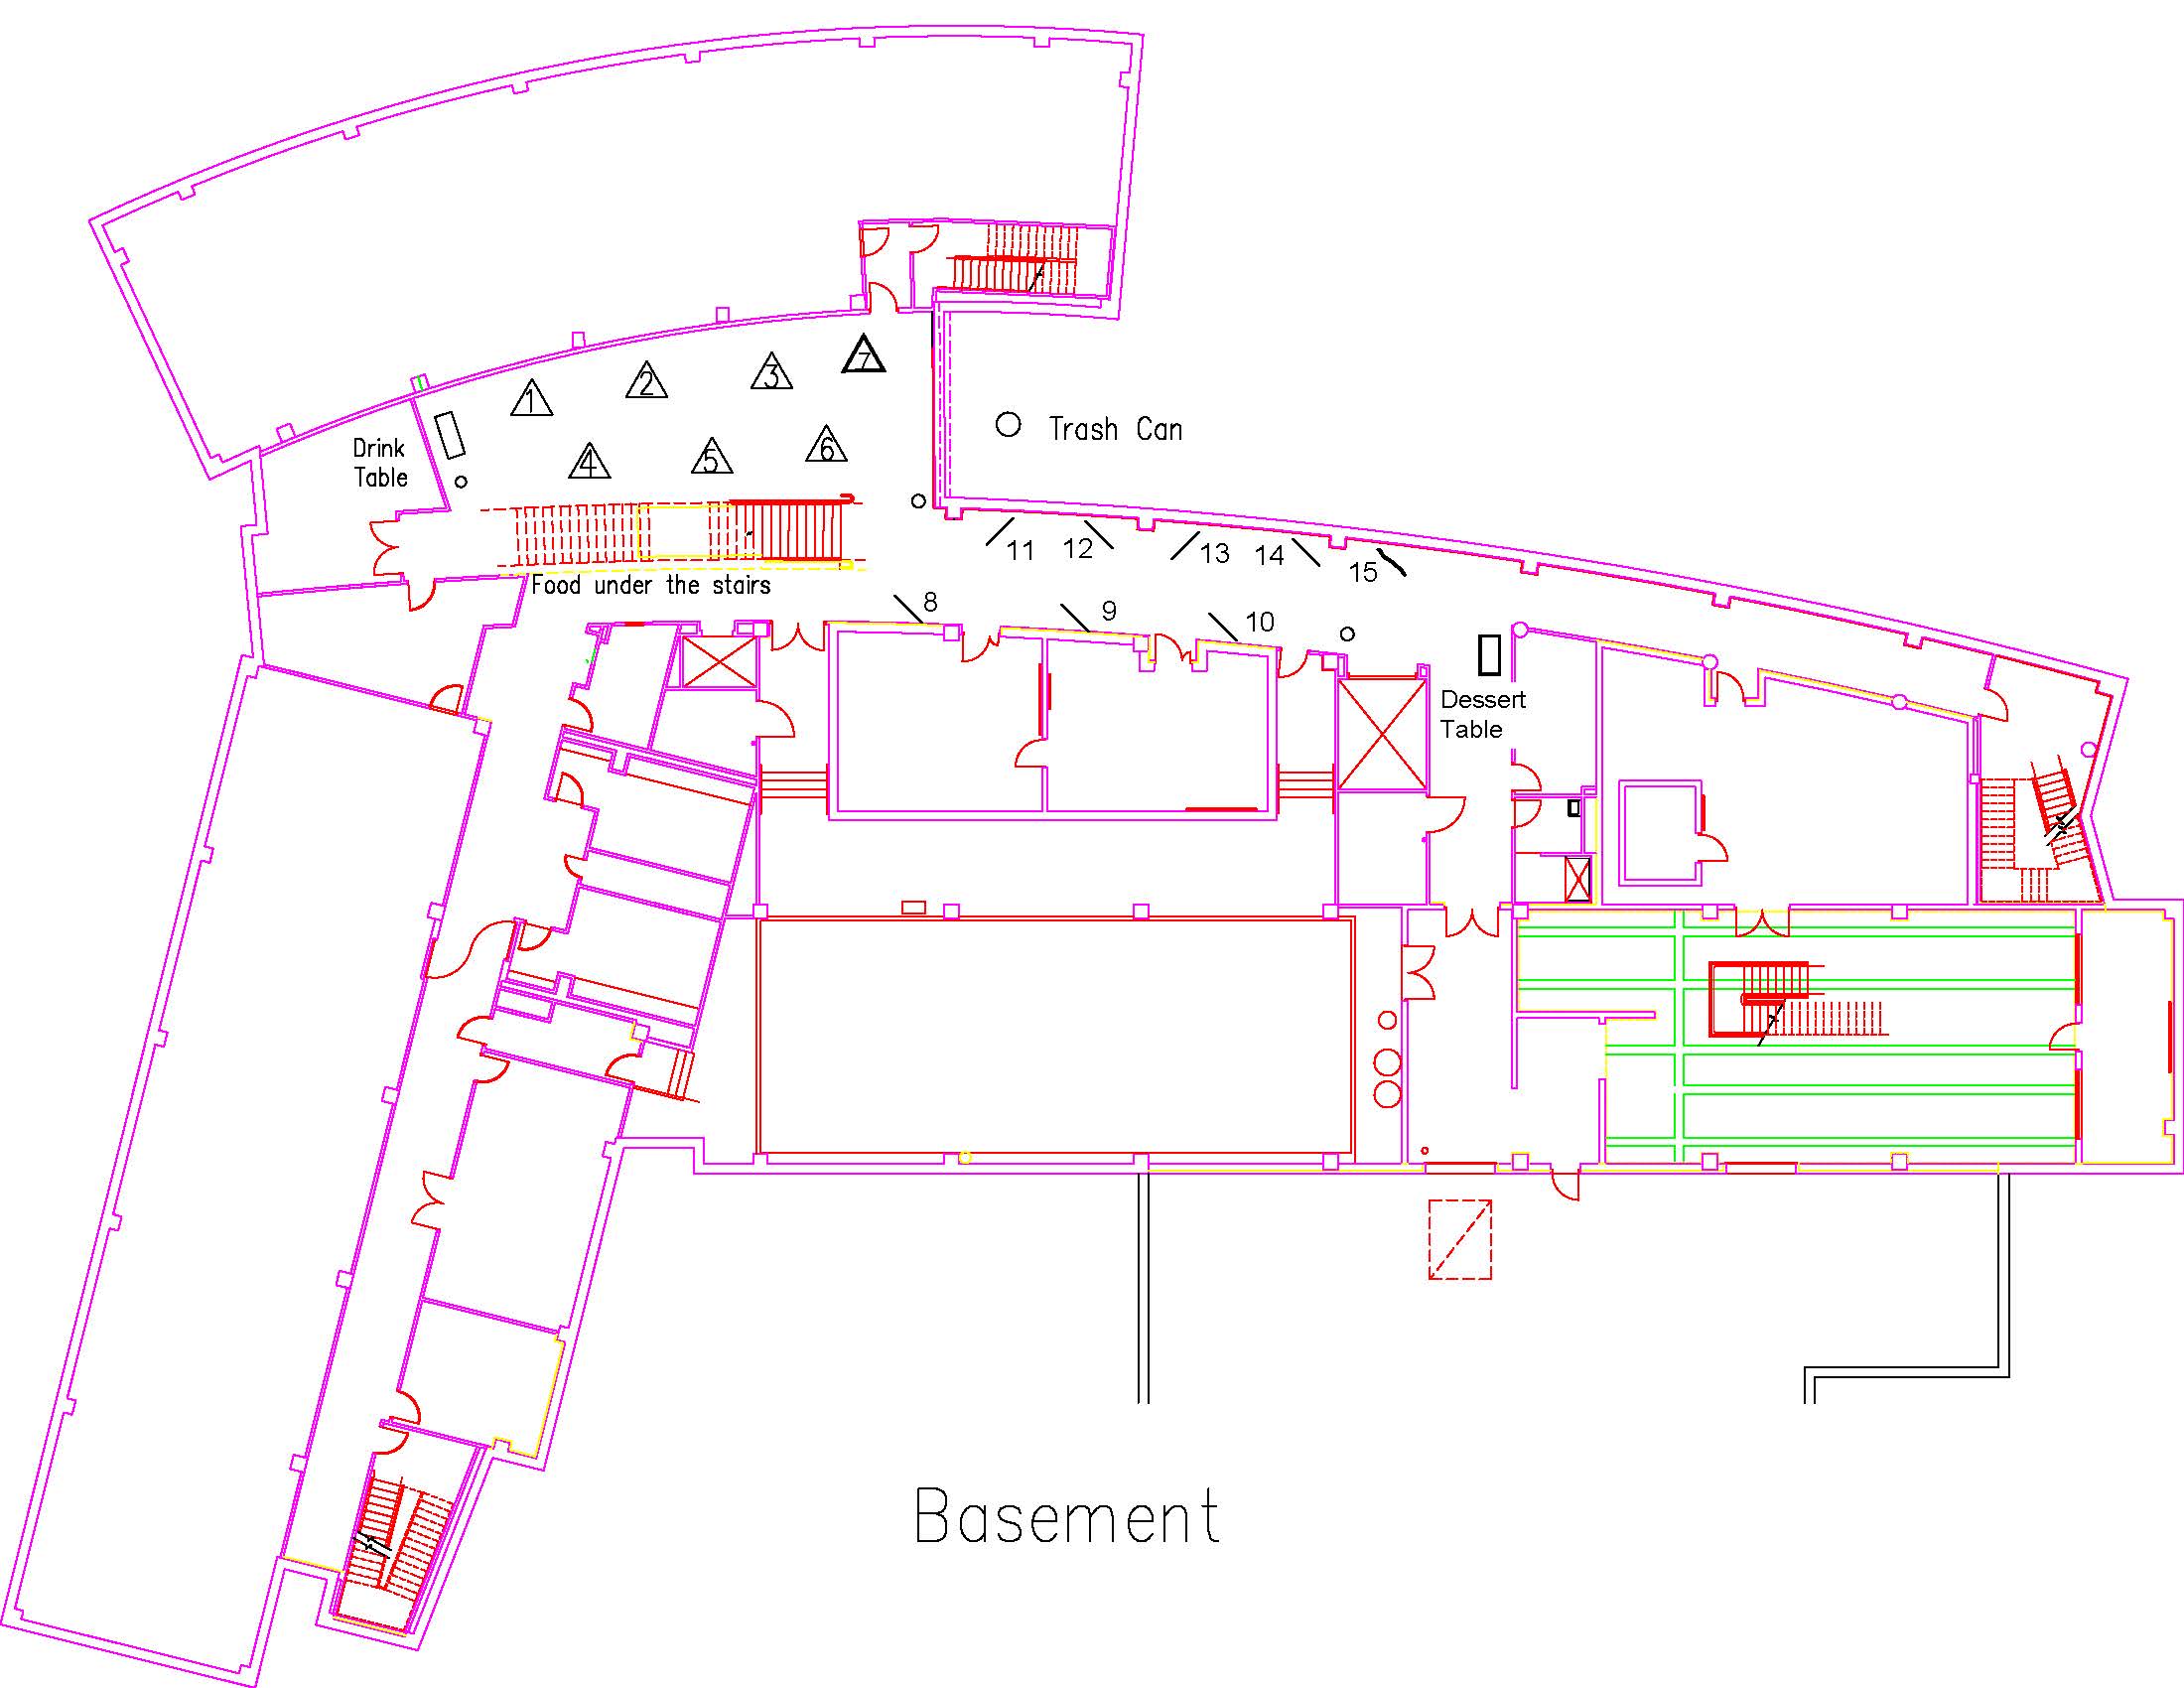
Location: Session: 2; Basement; Table Number: 11
View PresentationThe Palo Duro Basin is a northwest-southeast trending cratonic basin in the Texas Panhandle that formed from uplift of the Amarillo/Wichita Mountains during the Pennsylvanian, and subsequent subsidence during the Permian. Sediments were deposited in a number of environments, the most prominent being fan-delta, carbonate shelf, and deep basin settings. Major lithologies in the Pennsylvanian are granite wash, shelf-margin carbonates, and basinal shales, while the Permian hosts the same lithologies, as well as numerous evaporites and red-bed sequences.
This study analyzes log data from 100+ wells in the Palo Duro Basin to correlate and determine the lateral extent of different facies throughout the basin during the Pennsylvanian and Permian. Cross-sections made will help to generate isopach, structure, and other geological maps to identify areas where further geochemical and/or petrophysical analyses can be performed to evaluate Pennsylvanian and lower Permian shale gas potential of the Palo Duro Basin. This project will establish a more detailed stratigraphic framework of Pennsylvanian and lower Permian aged sediments of the basin, as well as determine source rock quality and thermal maturity for potential shale gas plays within the Palo Duro Basin, with a more thorough look along the southern fringes of the basin near the Matador Arch.
GEOL2019TERRELL64068 GEOL
Pennsylvanian and Mississippian Stratigraphy, Little Hoss Ranch, Johnson County, Fort Worth Basin, Texas
Type: Graduate
Author(s):
Aro Terrell
Geological Sciences
Advisor(s):
Richard Denne
Geological Sciences
Location: Session: 1; 2nd Floor; Table Number: 7
(Presentation is private)The primary objective of this study is to test my hypothesis that the stratigraphy within Little Hoss Ranch is very complex and diverse but correlative to the surrounding strata of similar depth and characteristics. The second objective is to identify characteristics of the stratigraphic facies to better aid in the production via recompletion or other determined methods within the Little Hoss area. Seismic data that will be analyzed within Little Hoss Ranch are made available by TEP Barnett. Seismic analysis will be done using Kingdom and will be assisted by the TEP geophysicist when possible. The goal is to use these data to better identify faults and other significant structural features within the area as well as the Barnett Shale stratigraphy for LHR. A map will be made using the seismic data and logs will be included in the map for reference and quality check purposes. The seismic, well log, and cutting data for the LHR that will be analyzed was originally acquired by Chesapeake as early as 2008 and is now owned by TEP, Barnett. 127 well logs will be analyzed using PETRA, within and immediately adjacent to the Little Hoss Ranch area, to better correlate and map the stratigraphy within the Little Hoss Ranch and will be tied to the LHR wells with surrounding wells in Johnson County and Tarrant County to create regional cross-sections. An additional cross-section will be created with the wells to the north in Tarrant County to display structural trends and stratigraphic facies correlation. The 127 LHR wells will be used to create a detailed structure map that can be compared to the seismic time structure map. The BHT will be used from the well logs as well as production data (oil to gas ratio) to determine if differential thermal maturity occurred within the area The overall goal of this project is to analyze the stratigraphy and structure of the Barnett Shale play within the Little Hoss Ranch confines and to identify any geologic effects or geologic solutions to marginal production for the area of study. Seismic data, well-logs, core and cuttings, mud-log descriptions, and background literature research will be used to conduct a thorough investigation into the stratigraphy affecting the LHR. The wells in the LHR will be used with wells in northern parts of the Fort Worth Basin to create a cross section spanning a larger area. This will help to better correlate the stratigraphy for the basin and help identify depositional and erosional changes in the Fort Worth Basin. Additionally, the OGIP data and calculations will be used to help define what the remaining hydrocarbon value is for the Barnett Shale within LHR.
MATH2019RABBY57606 MATH
Invariants of Triple Conics in Projective Three Space
Type: Graduate
Author(s):
Fazle Rabby
Mathematics
Advisor(s):
Scott Nollet
Mathematics
Location: Session: 1; Basement; Table Number: 12
View PresentationAn algebraic curve is a one-dimensional set defined by polynomial equations, such as a parabola in the plane (given by y-x^2=0) or the z-axis in the space (given by x=y=0). Let Y be an algebraic curve. Then a multiplicity structure on Y is another curve Z, which as a set has the same points as Y but with a higher and fixed multiplicity at each point. For example, the y-axis in the plane is given by the equation x=0 and if we intersect it with horizontal lines, say with y-b=0, we get the points (0,b) on the y-axis. Now if we take the line given by x^2=0 and intersect it with the horizontal lines as above we get the points (0,b) with multiplicity 2. Hence we call the later curve a double structure on the previous one. Similarly the equation x^3=0 gives a triple structure on the y-axis in the plane and so on. Structures like these might sound naive but they are crucial to understand the behaviors of families of curves. For example, the family of parabolas ty-x^2=0 deforms into the double line x^2=0 as t approaches 0. Although the notion of multiplicity is pretty geometric, we can use tools from abstract algebra to make it rigorous. This makes the subject challenging and yet very interesting at the same time. Classifying the multiplicity structures on a curve is still a wide open field in algebraic geometry. It is now well understood how the double and triple structures on a line look. A natural question then arises how do the double and triple structures look on conics? It turns out that the answers are much more complicated than for lines. In this poster I am going to show some of my research in that direction.
MATH2019WAGNER64069 MATH
The Crossed Product Structure of C*-Algebras Arising from Uniformly Recurrent Subgroups
Type: Graduate
Author(s):
Douglas Wagner
Mathematics
Advisor(s):
José Carrión
Mathematics
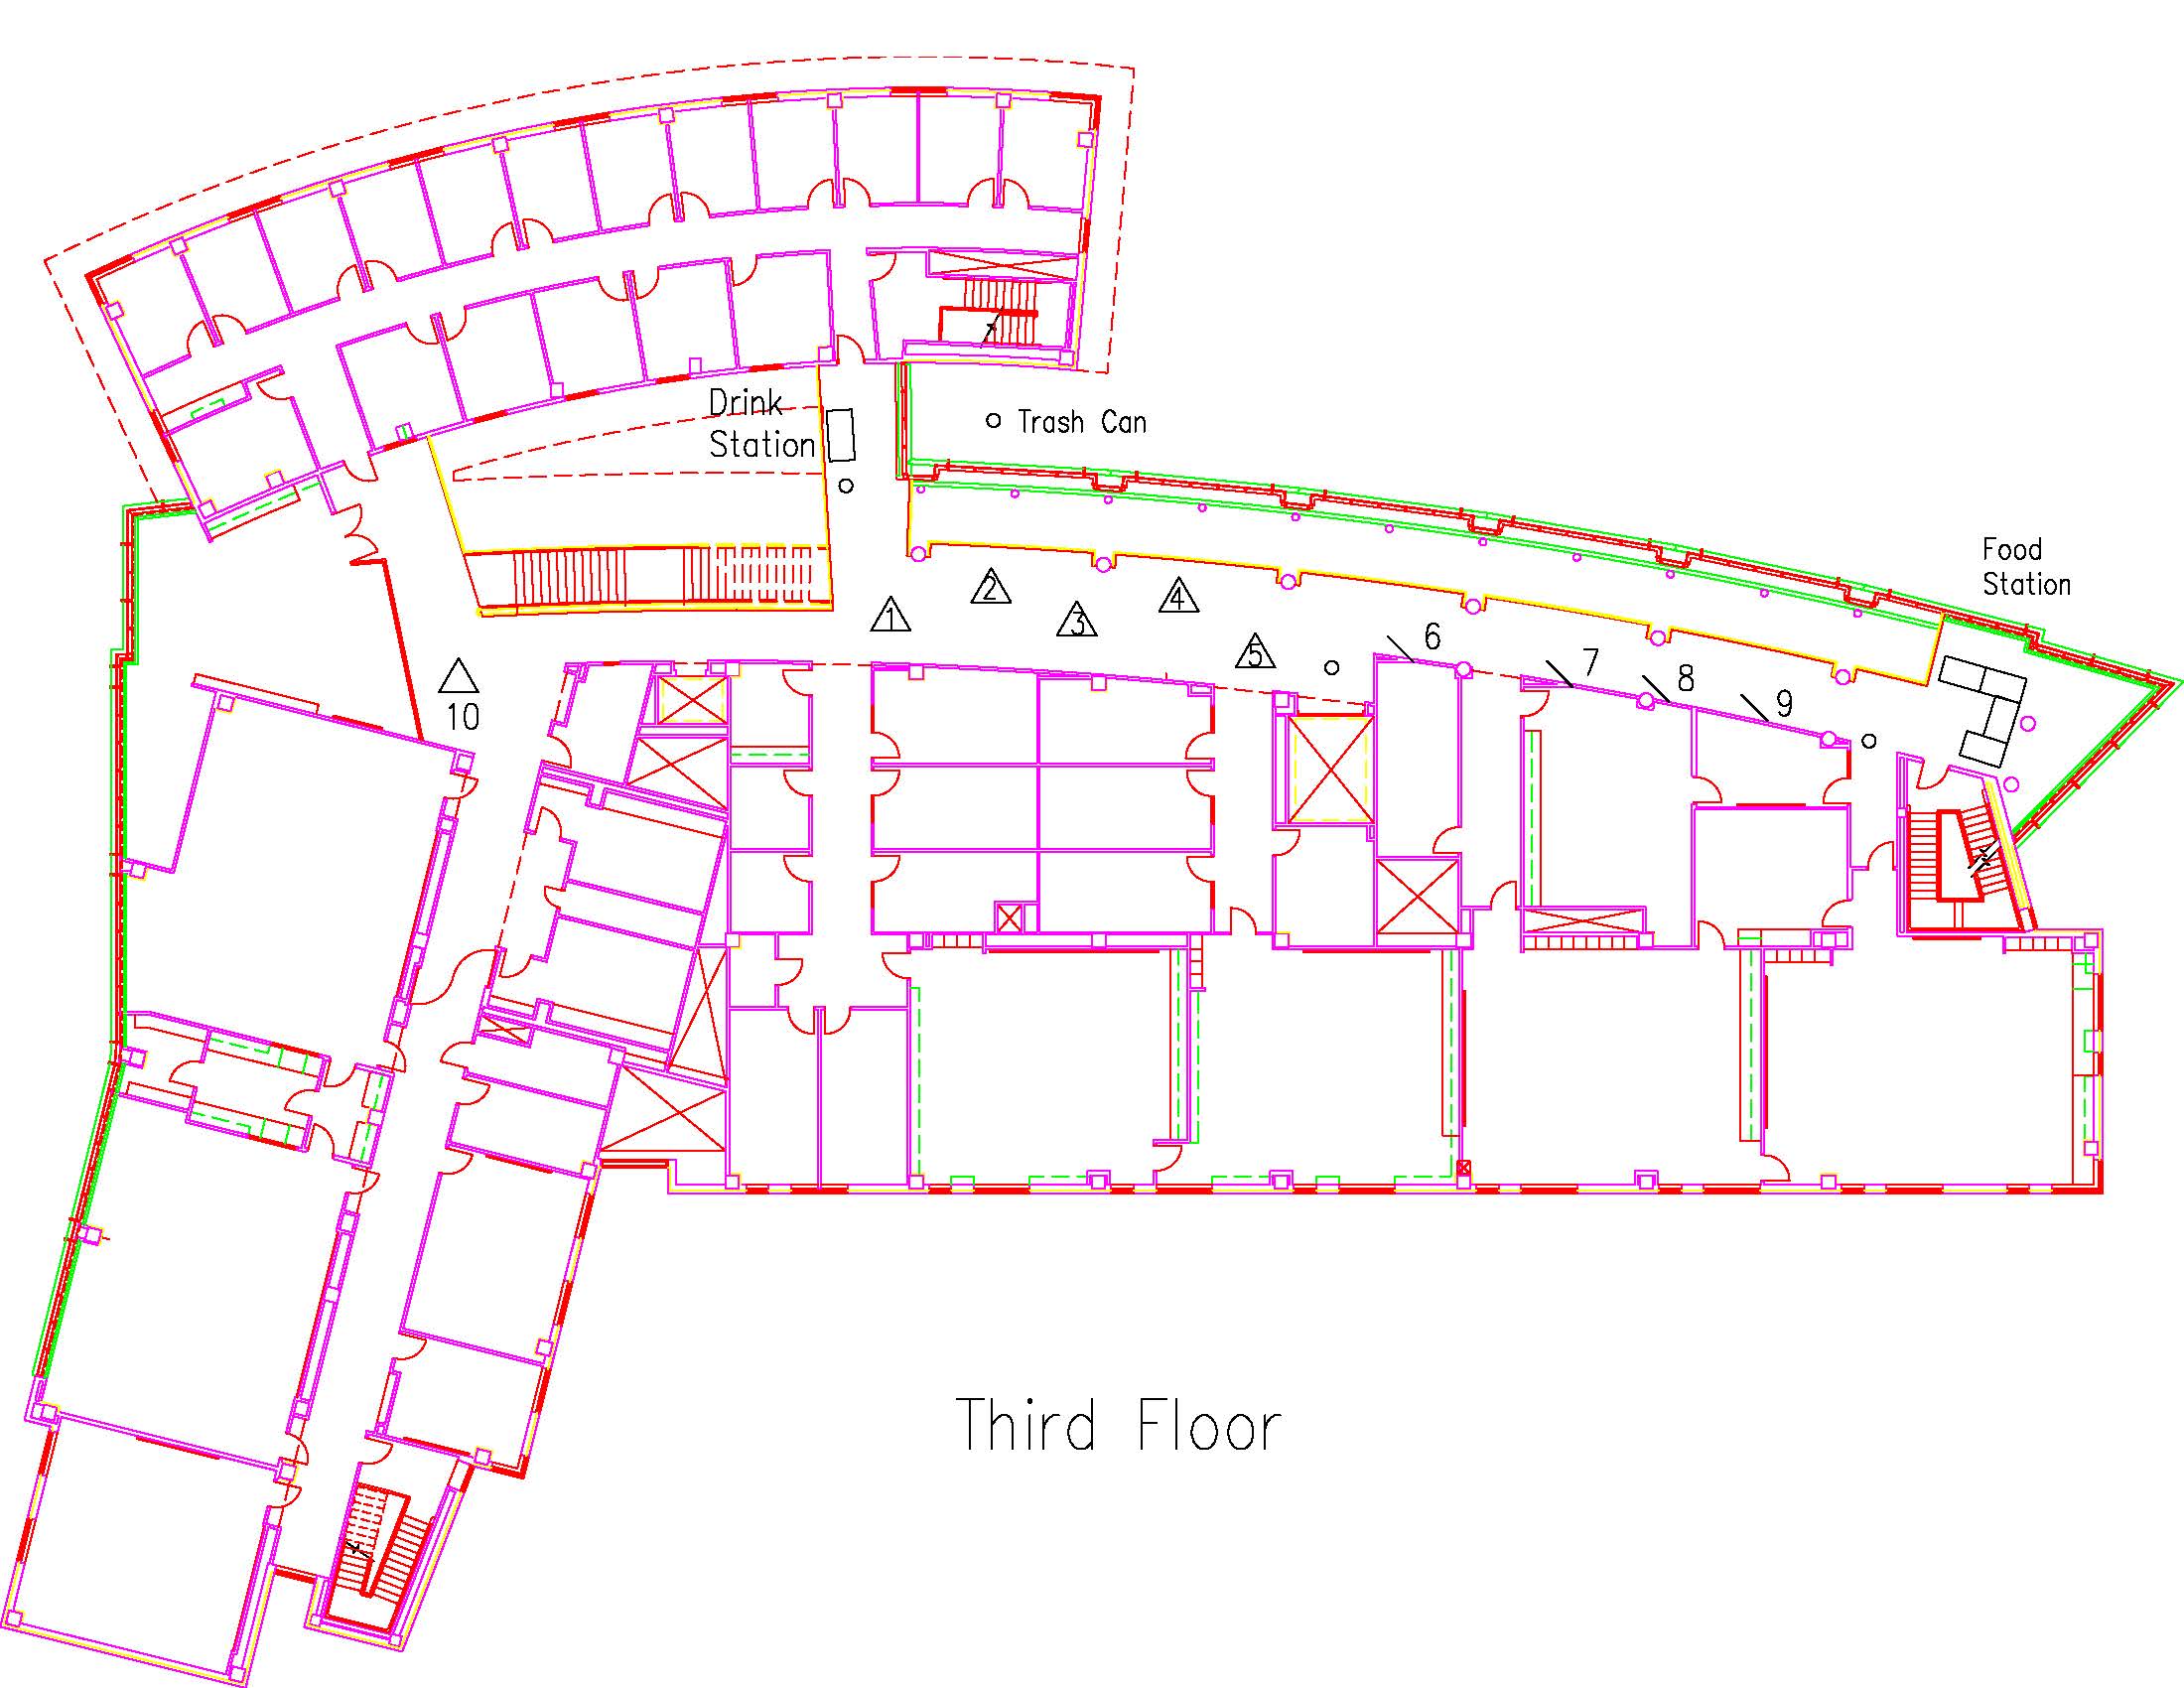
Location: Session: 1; 3rd Floor; Table Number: 2
View PresentationA group is a mathematical construct that represents the symmetries of an object. These symmetries transform the object through what is called a group action. Graphs—Cayley graphs, in particular—provide a rich source of symmetries for forming groups. A graph and its group action can be modeled by a collection of infinite matrices known as a C*-algebra. In a paper in the Journal of Functional Analysis, Gábor Elek used dynamical systems called Uniformly Recurrent Subgroups (URS) to construct a new type of C*-algebra. We relate this C*-algebra to a well-known construction called the crossed-product. This reinterpretation more prominently displays the group action, which proves useful as we further study the C*-algebra’s structure.
PHYS2019CAMPBELL56087 PHYS
Graphene Quantum Dots as Imaging, Sensing, and Delivery Agents
Type: Graduate
Author(s):
Elizabeth Campbell
Physics & Astronomy
Giridhar Akkaraju
Biology
Roberto Gonzalez-Rodriguez
Chemistry & Biochemistry
Md. Tanvir Hasan
Physics & Astronomy
Advisor(s):
Anton Naumov
Physics & Astronomy
Location: Session: 2; Basement; Table Number: 10
View PresentationGraphene quantum dots (GQDs) are novel materials with a number of unique properties that can be applied in electronics, sensing and biotechnology. GQDs possess physical properties that are critical for biomedical applications, including small size (3-5 nm), high quantum yield, and pH-dependent fluorescence emission in the visible/near-infrared, providing a possibility of molecular imaging, and pH-sensing. They also show very low cytotoxicity suggesting high potential for multiple biomedical applications. GQDs can also be doped to form nitrogen doped graphene quantum dots (N-GQDs), sulfur doped graphene quantum dots (NS-GQDs) and boron nitrogen doped graphene quantum dots (BN-GQDs), which allow these optical properties to be adjusted. We utilize and modify these properties to yield a multifunctional delivery/imaging/sensing platform geared toward the analysis of cancer therapeutics delivery in vitro. In our work, we outline how GQDs can serve as potential drug transport agents and as molecular markers for imaging the delivery pathways. Optimal emission and excitation are selected for each quantum dot to minimize the autofluorescence of cells, allowing them to be imaged in vitro. Emission in healthy (HEK-293) and cancer (HeLa and MCF-7) cells is quantified for a variety of pH environments to identify the ideal conditions for cellular internalization and pH-sensing of acidic cancerous environments. In addition, in vitro fluorescence microscopy analysis provides quantitative assessment for accumulation in cells. The results of this work suggest GQDs as innovative and effective highly biocompatible multifunctional platforms for cancer therapeutics.
PHYS2019CERESA50306 PHYS
How to deal with inner filter effect in fluorescence experiments
Type: Graduate
Author(s):
Luca Ceresa
Physics & Astronomy
Jose Chavez
Physics & Astronomy
Ignacy Gryczynski
Physics & Astronomy
Joe Kimball
Physics & Astronomy
Advisor(s):
Zygmunt Gryczynski
Physics & Astronomy
Location: Session: 1; 2nd Floor; Table Number: 2
View PresentationFluorescence is a very useful and popular technique which has been used in a wide variety of fields and, of late most importantly, at the intersection of biophysics, biochemistry and medicine. Despite being relatively simple from a theoretical point of view, it turns out that practical applications can have trivial problems that can cause significant spectroscopic problems. Specifically, an often overlooked yet fundamental obstacle in fluorescence spectroscopy is the nonlinearity of fluorescence intensity versus fluorophore absorption. This is referred to as the inner-filter effect. In literature, it is divided into a “primary inner-filter effect” and a “secondary inner-filter effect”. The former is caused by the absorption of the excitation light, which results in the lowering of the intensity of light reaching deeper regions of the solution. The latter is represented by the reabsorption of the emitted fluorescence by the fluorophores in the solution. Due to the fact that the primary inner filter effect is a direct consequence of the high concentration of the solution, to observe the secondary inner filter effect it is necessary to have a chromophore which absorbs part of the light that is emitted by the main fluorophore. Although working with low concentrations is generally recognized as a good practice to avoid artifacts related to inner filter effects, the primary inner filter effect can occur even at low absorbances (< 0.05). Furthermore, it is possible that using solutions with high absorbance is strictly necessary in studying the photophysical properties of fluorescent dyes and the interactions of biological macromolecules. Therefore, a reliable correction method for inner filter effects is fundamental for spectroscopic studies. Since it has been reported that the existing methods for correcting the fluorescence intensity are hard to implement in practice, we propose a strategy based on the previous calculation of the so called “sensitivity factor” of a spectrofluorometer. By mounting a cuvette on a movable holder in a square geometry setup, we can modify the position of the cuvette during a regular emission/excitation experiment. This allows us to determine the sensitivity factor. This result can be effectively used to correct the emission/excitation spectra to restore the linearity between absorbance and fluorescence intensity in samples characterized by high concentrations.
PHYS2019CHAVEZ34578 PHYS
Phosphorescence – Potential Biological Applications of Direct Excitation to the Triplet State.
Type: Graduate
Author(s):
Jose Chavez
Physics & Astronomy
Luca Ceresa
Physics & Astronomy
Ignacy Gryczynski
Physics & Astronomy
Joe Kimball
Physics & Astronomy
Advisor(s):
Zygmunt Gryczynski
Physics & Astronomy
Location: Session: 2; 3rd Floor; Table Number: 2
View PresentationFluorescence has grown to be the most sensitive detection technique used in a variety of biophysical, biochemical and medical applications for several decades. However, there is an interesting luminescence similar to fluorescence which causes an “afterglow effect” (“glow in the dark”). This is called “phosphorescence”. Phosphorescence has an exceptionally longer lifetime (milli or microseconds) compared to fluorescence (nanoseconds). This can be up to a million times longer. Modern fluorescence lifetime measurements require sensitive detectors that cost several ten to hundreds of thousands of dollars, while a phosphorescence lifetime detector can be in the thousands range. This detector uses ocean optics spectrometry with a phosphoroscope to measure phosphorescence. With this application we want to use it for studying protein dynamics such as shape, spacing, binding, etc. The novelty for this approach is using tryptophan as a probe for direct excitation to the phosphorescence triplet state. This means the usual encounter of fluorescence there is a continuous light source. When exposed the sample will emit its fluorescence. Once removed from the light source, since fluorescence is so fast when decaying, will expire off. However, with phosphorescence, after the removal of the light source, the sample still emits. This procedure if successful will circumvent fluorescence and just achieve phosphorescence. To study this we will be using PVA (poly vinyl alcohol [plastic]) with 5,6 – Benzoquinoline, Indole, and Tryptophan where the first compound is confirmed to have phosphorescence able to be seen even with the naked eye at room temperature. These will be studied in a device that will measure phosphorescence called a fluorospectrometer (Varian Eclipse) and the phosphoroscope. With this information we can find out what color (wavelength) to excite the tryptophan and circumvent fluorescence to phosphorescence.
PHYS2019CIAMPA28285 PHYS
Massive Winds Triggered by Supernovae in the Large Magellanic Cloud Galaxy
Type: Graduate
Author(s):
Drew Ciampa
Physics & Astronomy
Advisor(s):
Kat Barger
Physics & Astronomy
Location: Session: 1; Basement; Table Number: 6
View PresentationMassive amounts of gaseous material are being ejected from the nearby Large Magellanic Cloud (LMC) due to supernovae explosions occurring inside the galaxy. These explosions influence how gas cycles in and out of a galaxy and is crucial for our understanding of how galaxies evolve. Being the nearest gas-rich galaxy, the LMC provides us with an excellent opportunity to explore this gas cycle in detail. We have combined spectroscopically resolved observations to investigate the influence supernovae have on the LMC gas and the connection between supernovae explosions and the currently flowing galactic wind.
PHYS2019DONOR55459 PHYS
Old Problems Require Modern Solutions: a Data-Driven Approach to Modeling Stellar Populations
Type: Graduate
Author(s):
John Donor
Physics & Astronomy
John Wise
Physics & Astronomy
Advisor(s):
Peter Frinchaboy
Physics & Astronomy
Location: Session: 2; Basement; Table Number: 7
View PresentationThe problem of fitting isochrones, theoretical models of stellar populations, to the observed stellar populations (e.g. star clusters) has plagued observational astronomy for decades. A plethora of algorithms have been developed, but many fall short of their goals, and almost all are very computationally expensive. We present a new, computationally efficient technique made possible by first creating a fiducial representation of the data. This concise representation allows for a robust comparison to many theoretical models using a Markov-Chain Monte Carlo (MCMC) approach, quickly producing not only accurate fits but reasonable constraints on the final fitting parameters. The technique is applied to a number of star clusters, and the results are discussed in the context of Galactic chemical evolution.